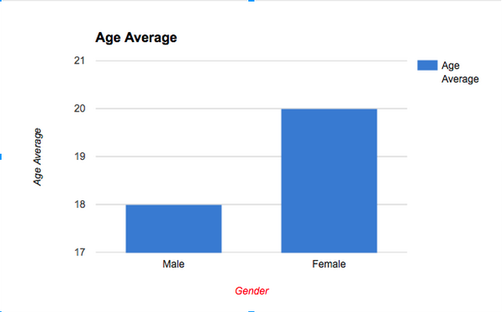
The graph shows the age average of females and males we gave the survey to.
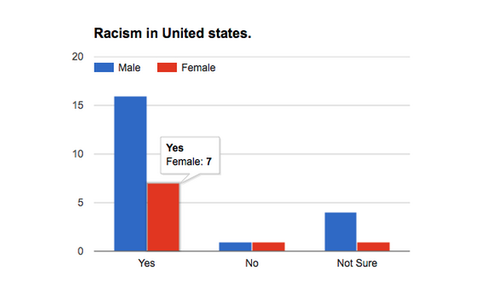
This show how many people think racism is in the U.S and also divided by gender.
The graph shows more Yes or not sure, so it is a serious problem.
The graph shows more Yes or not sure, so it is a serious problem.
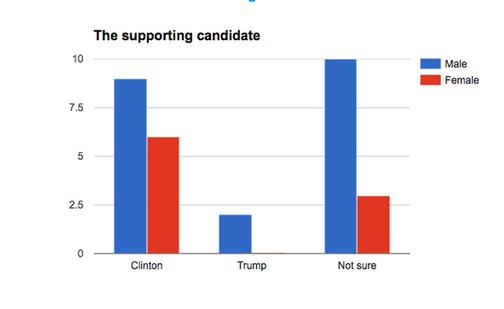
This graph shows how many males and females support which candidate. The result it's pretty obvious, since we are still teenagers we don't really know who is better or maybe we have a slightly better opinion toward one candidate.
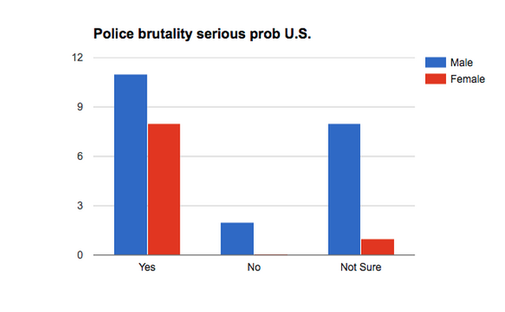
This graph shows if people think police brutality is a serious problem in the U.S. The result it's similar to the candidate one, a lot not sure or yes.
The people who agree must have seen on television or other parts how police shoots at black people.
